Data 2015 (eng)
Data on the laboratory-based surveillance of meningococci (2015)
Introduction
The Reference Centre for Meningococci and Haemophilus influenzae (NRZMHi) is assigned by the RKI with the performance of laboratory based surveillance of invasive meningococcal disease (IMD). In the year 2015, 384 samples from 330 individuals were analyzed. The NRZMHi confirmed Neisseria meningitidis in 258 patients, in 246 of them from primarily sterile compartments (latter figure corresponds to the number of cases with invasive disease). In 35 patients (out of 246) detection of meningococci was carried out using molecular techniques only. During the same period 287 cases of IMD were notified to the RKI (data as of 03.02.2016, SurvStat@RKI). These figures reflect a stable incidence rate for IMD of 0.36/100,000 compared to 0.34/100,000 in 2014. Given that all processed cases of IMD were notified retrospectively, one can assume an 86% coverage of IMD by NRZMHi (91% in 2014).
Frequency of serogroups (2015)

The proportion of serogroup C cases dropped further (14.6%), while that of serogroup B, Y and W cases remained constant (71.1%, 8.5%, 4.5%).
Serogroups according to age groups (2015)
The majority of serogroup C, W and Y cases occurred in patients aged 20 years or above.
Serogroups according to federal states (2015)
Serogroup | BW | BY | BE | BB | HB | HH | HE | MV | NI | NW | RP | SL | SN | SA | SH | TH | abr |
B | 23 | 21 | 8 | 6 | 6 | 8 | 8 | 3 | 12 | 37 | 15 | 5 | 5 | 6 | 10 | 2 | |
C | 8 | 6 | 1 | 1 | 2 | 4 | 7 | 5 | 1 | 1 | |||||||
W | 1 | 2 | 2 | 1 | 2 | 2 | 1 | ||||||||||
Y | 8 | 8 | 1 | 2 | 2 | ||||||||||||
E | 1 | ||||||||||||||||
Cases, N | 40 | 37 | 11 | 8 | 7 | 8 | 10 | 3 | 18 | 48 | 22 | 1 | 6 | 6 | 7 | 11 | 3 |
Incidence (cases at NRZMHi/ 100,000) | 0.37 | 0.29 | 0.32 | 0.33 | 1.06 | 0.45 | 0.16 | 0.19 | 0.23 | 0.27 | 0.55 | 0.10 | 0.15 | 0.27 | 0.25 | 0.51 |
|
BW: Baden-Württemberg, BY: Bavaria, BE: Berlin, BB: Brandenburg, HB: Bremen, HH: Hamburg, HE: Hesse, MV: Mecklenburg-Western Pomerania, NI: Lower Saxony, NW: North Rhine-Westphalia, RP: Rhineland-Palatinate, SL: Saarland, SN: Saxony, ST: Saxony-Anhalt, SH: Schleswig-Holstein, TH: Thuringia, abr: abroad.
The above table contains 246 cases. In 2 cases, the serogroup could not be determined. In 3 cases, disease onset was in Germany, but patients were visitors from abroad.
Geographic distribution of serogroups (2015)
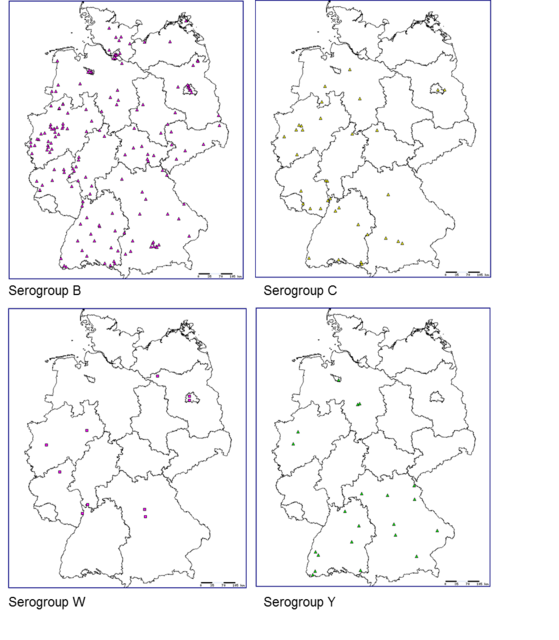
The coloured symbols represent cases with the respective serogroups. Serogroup Y predominates in the southern states of Germany.
All maps were generated with EpiScanGIS.
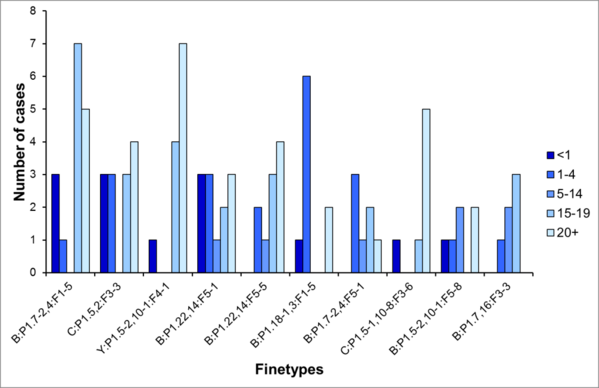
Most common finetypes (2015)
Finetype | Number of cases | % of cases |
B:P1.7-2,4:F1-5 | 16 | 6.9 |
C:P1.5,2:F3-3 | 13 | 5.6 |
Y:P1.5-2,10-1:F4-1 | 12 | 5.2 |
B:P1.22,14:F5-1 | 12 | 5.2 |
B:P1.22,14:F5-5 | 10 | 4.3 |
B:P1.18-1,3:F1-5 | 9 | 3.9 |
C:P1.5-1,10-8:F3-6 | 7 | 3.0 |
B:P1.7-2,4:F5-1 | 7 | 3.0 |
B:P1.7,16:F3-3 | 6 | 2.6 |
B:P1.5-2,10-1:F5-8 | 6 | 2.6 |
In 2015, a total of 110 different serogroup-PorA-FetA combinations (finetypes) were observed.
Most common finetypes according to age groups (2015)
Antibiotic susceptibility of invasive isolates
(According to EUCAST breakpoints 2015)
Antibiotic | sensitive | intermediate | resistant |
Penicillin | 168 | 25 (12.8%) | 2 (1%) |
Cefotaxim | 195 | ||
Rifampicin | 193 | 2 (1%) | |
Ciprofloxacin | 192 | 1 (0.5%) |
The proportion of penicillin intermediate susceptible and resistant isolates decreased from 19.1% and 2.9%, respectively, in 2014 to 12.8% and 1%, respectively, in 2015.
Disclaimer
The above data were generated with federal funds (RKI). Scientific use is prohibited without prior written consent by NRZMHi or RKI. Commercial use is strictly prohibited. Inclusion of figures or tables in talks or oral presentations is not allowed.
©NRZMHi 2016